Leave a Comment
Load-testing Apache Cassandra; Parsing Latency & Throughput Results (Part 1 of 3)
https://medium.com/linode-cube/load-testing-apache-cassandra-parsing-latency-throughput-results-part-1-of-3-1c0712166e40
Setting up the client and server
As previously stated, this is not a tuning guide, so let’s go ahead and install a stock Cassandra instance running on OpenJDK.
Server start-up script:
wget http://mirror.vorboss.net/apache/cassandra/3.11.4/apache-cassandra-3.11.4-src.tar.gz
tar xzf apache-cassandra-3.11.4-src.tar.gz
cd apache-cassandra-3.11.4-src.tar.gz
./bin/cassandra -f
This script will download, unpack and start a Cassandra instance on your server.
Take a note of the server’s private IP address (this is the address that the stress-client will use to connect to the server).
Client start-up script:
wget http://mirror.vorboss.net/apache/cassandra/3.11.4/apache-cassandra-3.11.4-src.tar.gz
tar xzf apache-cassandra-3.11.4-src.tar.gz
cd apache-cassandra-3.11.4-src.tar.gz
./tools/bin/cassandra-stress write -node $SERVER_IP
This script will download and start the stress-client, instructing it to perform a write throughput test against the server (replace $SERVER_IP with your server’s IP address).
By default, the client will start with a certain number of writer threads, sending write requests to the server until the mean request latency stabilizes. Once stable, the client will stop for a while, then continue with a larger number of write threads. This process is repeated until the number of write threads becomes quite high (913 on the test I ran).
Initial results
At the end of each run, the Cassandra-stress tool reports the throughput achieved and the latency at various percentiles. The first run is performed using 4 write threads:
Running with 4 threadCount
Op rate : 4,119 op/s [WRITE: 4,119 op/s]
Latency mean : 0.9 ms [WRITE: 0.9 ms]
Latency median : 0.8 ms [WRITE: 0.8 ms]
Latency 95th percentile : 1.5 ms [WRITE: 1.5 ms]
Latency 99th percentile : 3.3 ms [WRITE: 3.3 ms]
Latency 99.9th percentile : 8.8 ms [WRITE: 8.8 ms]
Latency max : 87.8 ms [WRITE: 87.8 ms]
All the way up to 913 write threads:
Running with 913 threadCount
Op rate : 74,949 op/s [WRITE: 74,949 op/s]
Latency mean : 12.0 ms [WRITE: 12.0 ms]
Latency median : 8.6 ms [WRITE: 8.6 ms]
Latency 95th percentile : 27.6 ms [WRITE: 27.6 ms]
Latency 99th percentile : 91.1 ms [WRITE: 91.1 ms]
Latency 99.9th percentile : 136.6 ms [WRITE: 136.6 ms]
Latency max : 235.9 ms [WRITE: 235.9 ms]
Plotting the results on a chart makes for easier analysis, so let’s look at a couple of different renderings of these data.
Write-throughput vs thread count
Predictably enough, as the number of writer threads increases, so too (initially) does the achieved throughput:
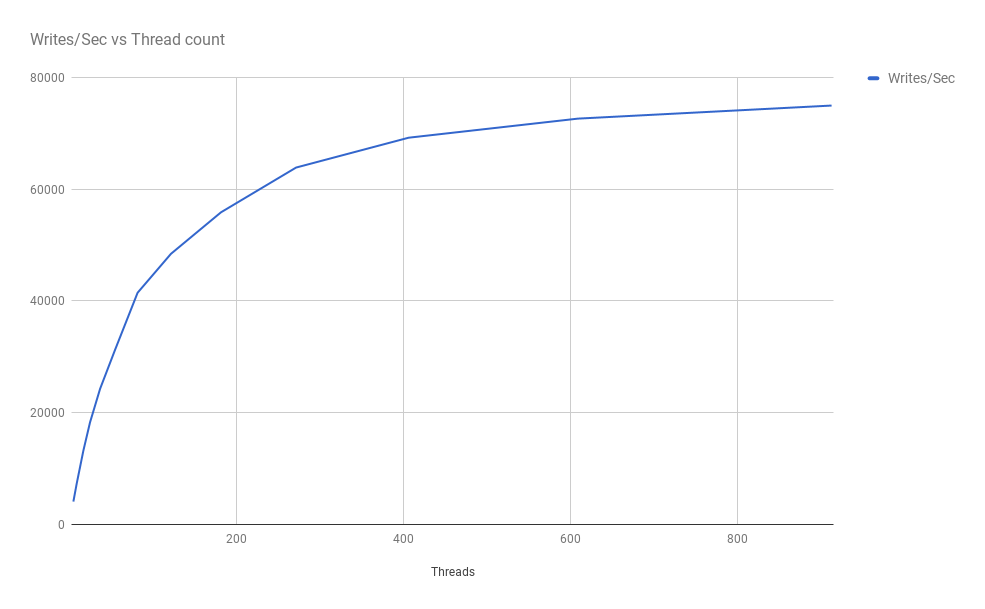
However, the write throughput eventually tails off and approaches a ceiling. This could be a result of the client’s not being able to generate enough requests to saturate the server; or because the server cannot service a higher request rate. I will explore these possibilities in greater depth in a subsequent post.
Latency vs write-throughput
This chart shows that the mean latency remains relatively stable (and quick at less than 15ms) as the throughput increases, but the outliers at the 99th and 99.9th percentile suffer as the server has to process more requests:
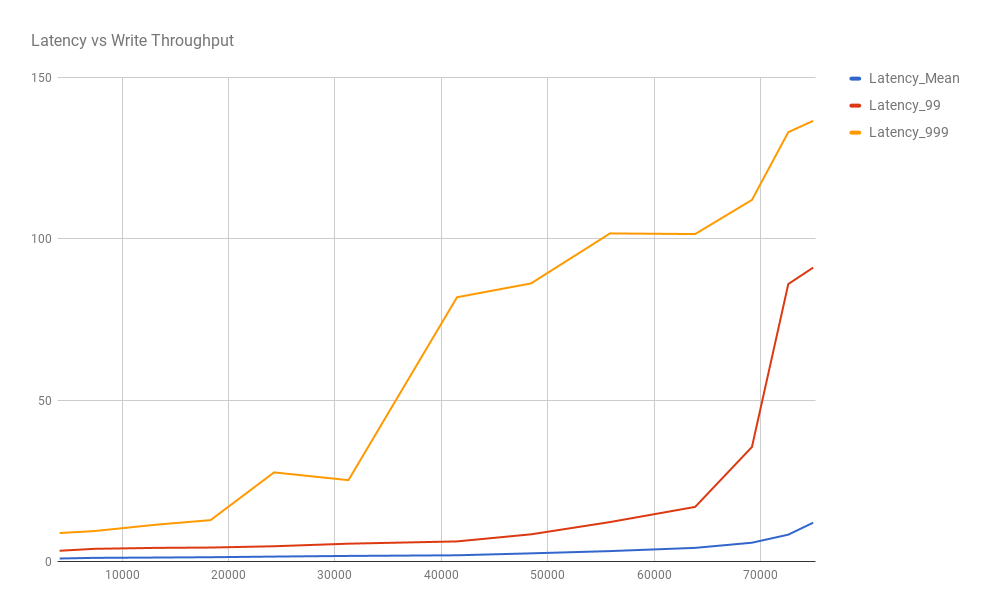
This is a fairly standard result when pushing a system (whether that is the server or the load generator) to its limits.
Wrapping up
In this post, I have covered how to set up and load-test a stock install of Apache’s Cassandra in-memory database. Cassandra comes with a bundled load-testing tool that makes this kind of investigation much easier.
When exploring what sort of performance a system can deliver, it is useful to phrase your requirements (or findings) in terms respective of SLAs, such as the request latency that can be expected by a client at a certain level of throughput.
Visualizing the results from this battery of stressors is a quick way to grasp how any system under test will respond as the experienced load increases, which in turn can help with capacity-planning.
From this simple testing process, I can state that a single-node Cassandra instance on the provisioned server VM can sustain the following latency profile for a synthetic write-heavy workload:
30,000 writes/sec, mean latency 1.7ms, 99%ile 5.5ms, 99.9%ile 25.2ms
70,000 writes/sec, mean latency 8.3ms, 99%ile 86ms, 99.9%ile 133.1ms
In the next post, I will take a look at what is happening on the server, and gain some insight into where the system limits lie.